 Click
to enlarge.
Click
to enlarge.Gamma Ray Log, Sonic Log
Conductivity Log, Density Log The McClure Plot™
VSP and Check Shot Data
Seismic 3D Velocity Analysis
Click to enlarge the pore pressure log editing session. Baird combines and selects the appropriate method to measure and to predict pore pressure and rock properties from all available data. Baird has standardized its techniques based on over 2000 well studies. For each well or offset control well, geologic, drilling and wireline data is assembled and interpreted by Baird using both computer algorithms and geologic analysis.
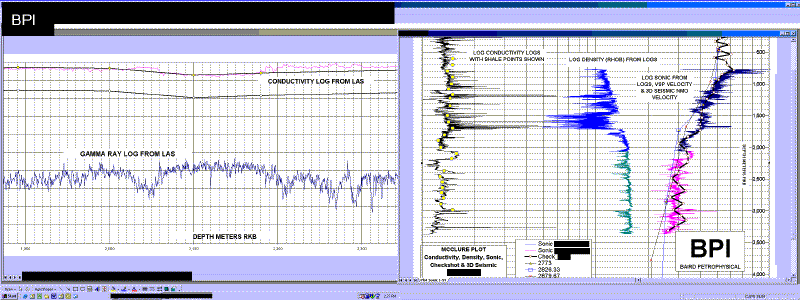
The above workstation screen prints shows on the left side two well logs: Gamma Ray and Conductivity. Shale zones are identified from the Gamma Ray and then a suitable Conductivity value is manually selected that is representative of each shale zone. This method is more accurate and requires slightly more thinking than what other companies recommend. Baird does not depend on the computer doing the selection and averaging; instead, each sample is carefully selected and can be changed, if necessary while other data, including RFT's, Drilling Diaries and Mud Logs are analyzed for direct and indirect evidence to support the interpreted pore pressure and rock properties, such as frac gradient.
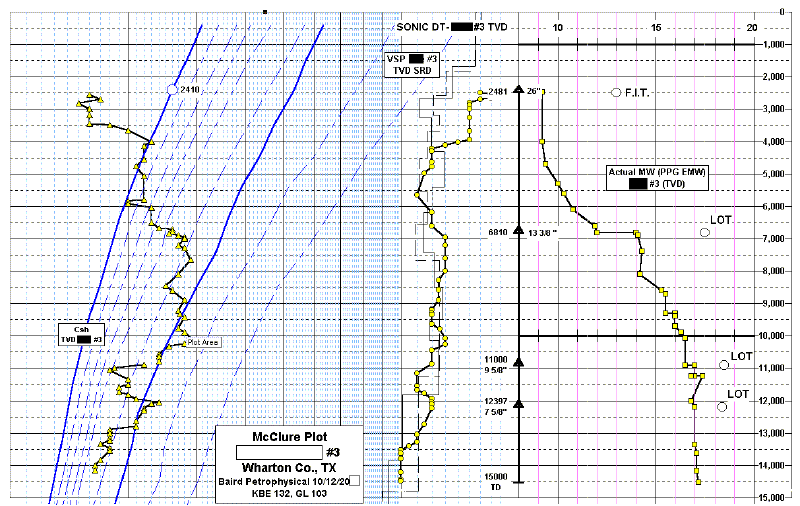
The screen on the above right is Baird's McClure Plot™ which can be prepared manually or by computer. On the Baird McClure Plot™ is a complete record of the well drilled including geologic age and paleo markers, lithology, faults, unconformities and drilling parameters including mud weight, ECD, leak off tests, casing points, reported flows, stuck pipe and any information useful to assist the drilling of new wells in the area.
 Click to enlarge the McClure Plot™ session.
Above is data plotted using Baird's McClure Plot™. On the left is Shale Conductivity, center is Shale Delta-T and Seismic ITT from two nearby velocity analyses. On the right is the casing and actual mud weight used to drill the well. The other data are measured leak off tests. The Baird McClure Plot™ is a standard presentation designed by Leo J. McClure and Eugene Pennebaker to study the effects of pore pressure and lithology on the available physical log measurements. Baird maintains thousands of wells, each of which is plotted in the identical form. These wells cover not only the Texas and Louisiana on-shore and offshore, but extend to the deep water and almost every oil basin and lithology type in the world.