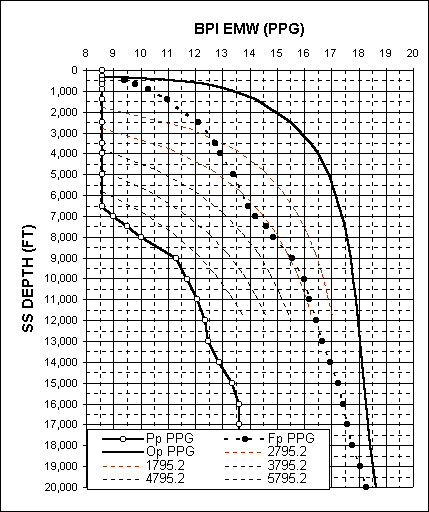
This is one form of a display of equivalent depth curves: the BPI EMW Plot. There are several forms used in our analysis, depending on the local geology.
Lesson: The equivalent depth curves can in some cases be thought of as constant shale porosity curves; i.e. if you see a flat shale conductivity curve while drilling, the expected formation pressure gradient will follow an equivapent depth curve: i.e. a pressure gradient increase with increasing depth. A good pressure top seal/latteral seal follows these curve slopes on the BPI EMW lot.