The seismic data we use for pressure analysis has come from many sources, depending on the actual circumstances of the assignment. We do a better and quicker job if we can pick and choose the data we want to use. When someone else picks for us, this has created delays and usually the data someone else selects is not the appropriate data to use for our seismic pressure prognosis. For this reason, we encourage a Geologic Review meeting or teleconference to gather the information we require. Often times, the best data may either not be available or it will take too long to access, with the usual short deadlines for our typical pore pressure study.
We need accurate seismic interval velocities over the proposed well site's surface and bottom hole locations and, we need data located down-dip and in a basinal trough, away from the location to be drilled. We need as much velocity data as we can get. We will be limited to the amount of time we have to conclude our study and limited to the quality and quantity of data available.
Usually simple stacking velocities are not enough and additional work including re-processing of the seismic data is required, if there is enough time. Baird has reprocessed customer seismic data in less than 24 hours when necessary.
Processing sequence/history is important to know what we are dealing with when it comes to seismic stacking velocities. The most common use of stacking velocities is to stack the seismic data to create a image of the subsurface. These velocities do not have to be as accurate as we need to do an excellent job of pressure prediction. Even some geophysicists do not understand this comment. Let us show you why so that you can understand what it takes to do the job right.
Automatically picked velocities do not work. The trend today in seismic data processing and amongst highly educated processing managers is to create more automation or systematic results. The reason is because the data sets have grown immensely to mega-proportions, sometimes exceeding hundreds of terabytes. These may help the imaging quality, but they do not help the pore pressure analysis. Too much is at stake to trust the automatic velocities. We can prove this to you with examples.
ASCII Flat File Formats or print outs or Xerox copies of the stacking velocities. Formats supported include all seismic data processing formats from seismic processing companies, seismic contractors and major oil company geophysical departments. To date these include: Western Geophysical, Veritas Geophysical, CGG, TGS (Promax), Nutec (Arco), Diamond Geophysical, PGS, BP (Amoco), Kelman Technologies, Geosignal (Disco), Spectrum Geophysical (Seisup), ChevronTexaco, Shell, ConocoPhillips, Unocal, Colorado School of Mines CWP SU, and GNS Globe Claritas.
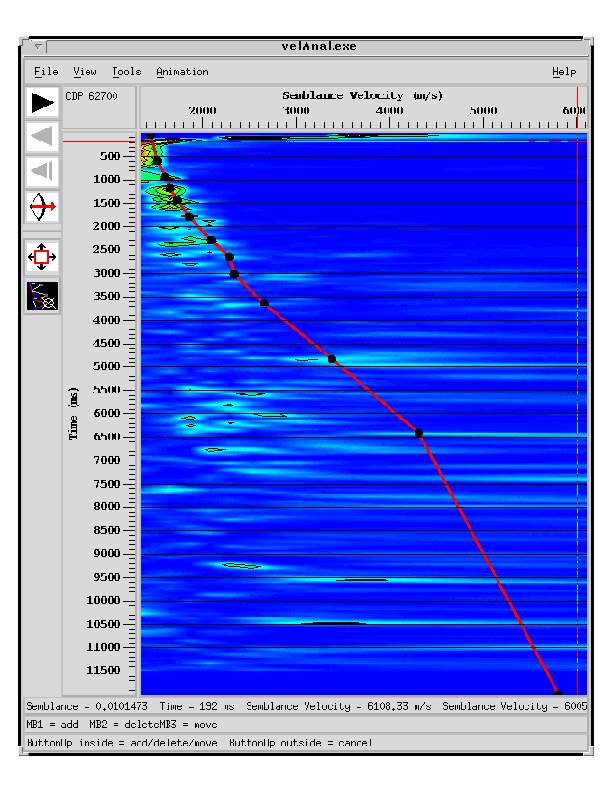
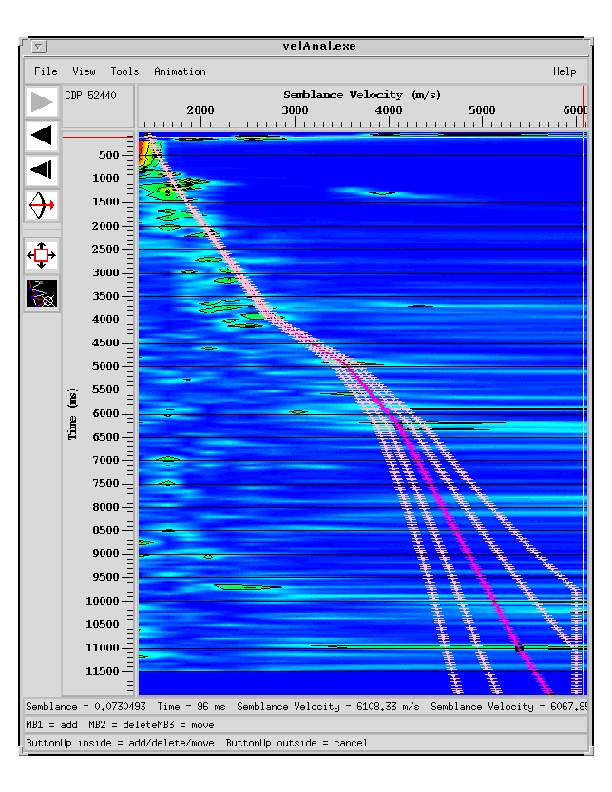
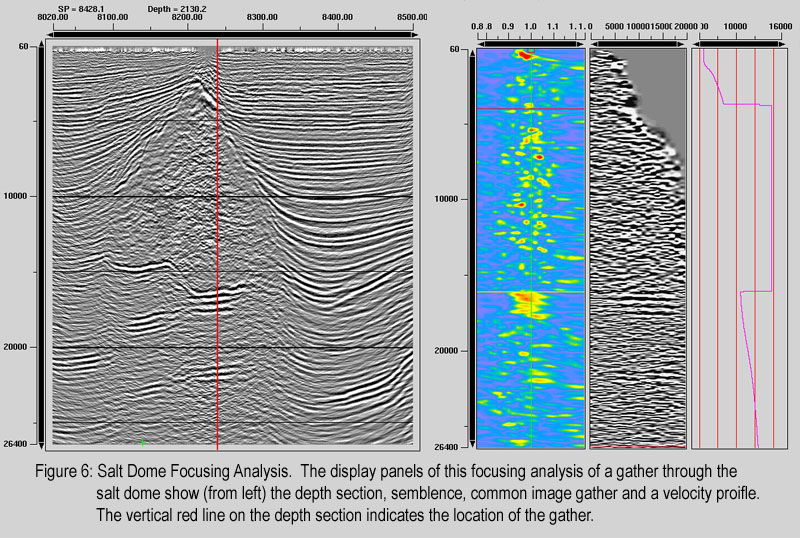
Semblance Plots/Matrix
![]()
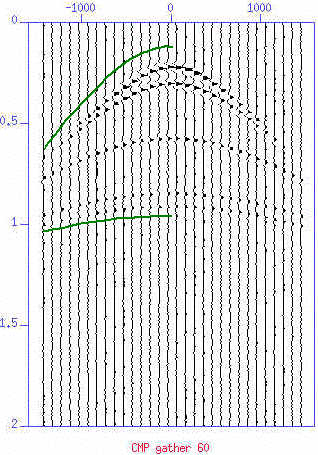 A synthetic CMP gather that shows the lowest possible velocity (upper green
hyperbola) and the highest possible velocity (lower green hyperbola).
A synthetic CMP gather that shows the lowest possible velocity (upper green
hyperbola) and the highest possible velocity (lower green hyperbola).
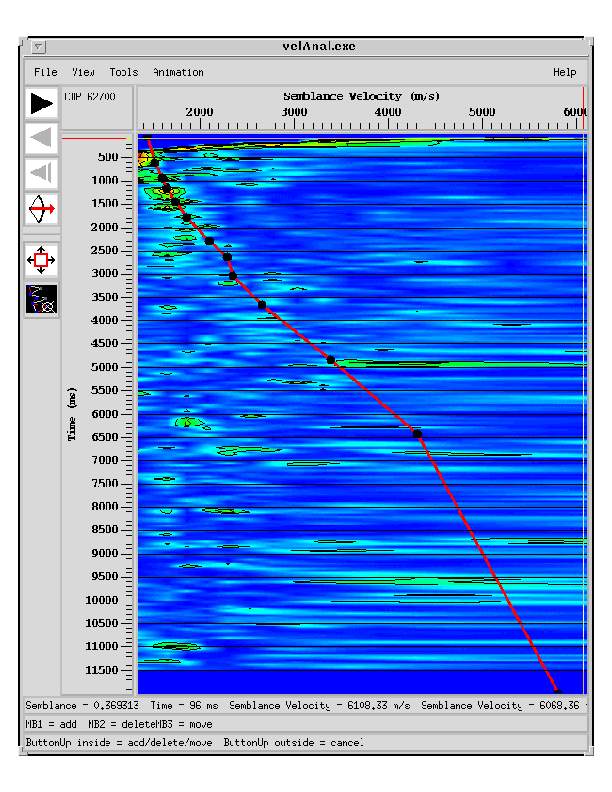
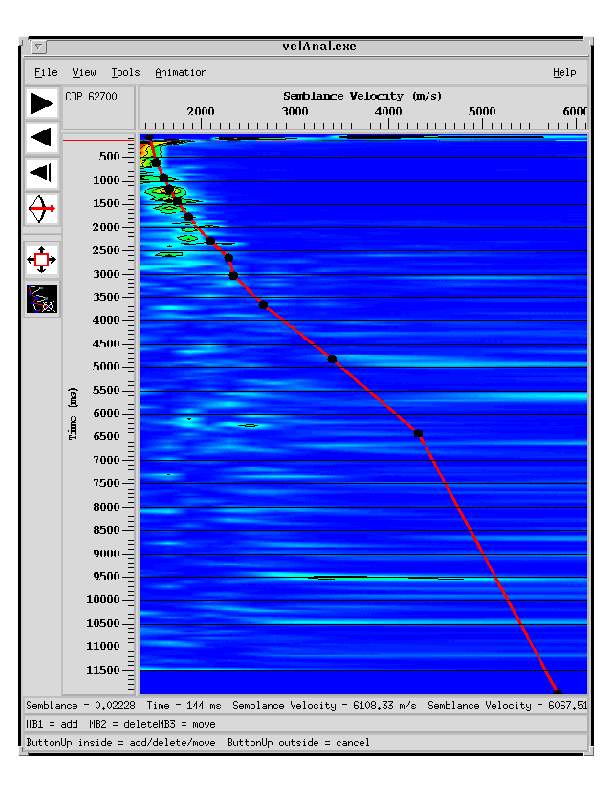
Travel Time Cross-correlation Matrix